YOONCHAN WRITES / RESEARCH
The Effect of Water Hardness on EDTA Titration
Chemistry
A Study of the Effect of Water Hardness on the Amount of EDTA Required for Titration
Research Question
How does water hardness affect the amount of EDTA required for titration?
Introduction and Background Knowledge
A water-hardness experiment is a titration that uses chelation to determine the concentration of dissolved metal ions in water.
Metal-ion concentration: Water contains various dissolved metal ions. In water-hardness experiments, the concentrations of calcium and magnesium ions, the most abundant and representative ions, are used as the basis for measurement. Water with a combined concentration of these ions of 120 mg/L or higher is considered hard water, whereas water below that level is considered soft water.
Chelates: A chelate is formed when a ligand makes coordinate bonds with a metal ion. A ligand is a molecule that donates an electron pair to a central metal ion, and a coordinate bond is a type of covalent bond in which one atom supplies the shared nonbonding electron pair. (2014, Chemistry) In the chelation titration used for this experiment, the ligands are the Eriochrome Black T (EBT) indicator and the EDTA solution.
EBT indicator: The color of the EBT indicator changes depending on the pH of the aqueous solution and whether it is bound to metal ions. It appears red below pH 6, blue between pH 6 and 11, and orange above pH 11. When bound to metal ions it appears red, and when those bonds are broken it appears blue. EBT responds most effectively at pH 10. (2008, haudaa)
EDTA solution: EDTA binds very strongly to metal ions in water and is used as the titrant for determining water hardness. Because EDTA binds metal ions much more strongly than the EBT indicator does, adding EDTA to the sample breaks the bonds between EBT molecules and metal ions; the ions bind to EDTA instead. As titration continues and the metal ions are removed from the EBT complexes, the sample suddenly turns blue at the endpoint. (2008, haudaa)
Standard buffer solution: Because EBT functions most effectively at pH 10, a buffer solution is needed to maintain this pH. A standard buffer solution resists changes in pH. (2010, ReportWorld)
ppm: The abbreviation ppm means “parts per million” and is used to express very small concentrations. One ppm represents a ratio of one part in 1,000,000. (2010, ReportWorld)
Dilution formula: The dilution formula is used when diluting solutions or calculating the number of moles of an unknown solution in a titration. It is written as M × V = M′ × V′. Here, the left-hand side represents the moles of EDTA solution, while the right-hand side represents the moles of metal ions in the sample.
Hypothesis
The hypothesis is: “The greater the water hardness, the larger the amount of EDTA required to reach the endpoint.”
This is because the number of EDTA molecules needed to bind metal ions depends on water hardness, that is, the quantity of dissolved metal ions.
Variables
Independent variable: The independent variable is the type of water sample whose hardness is being measured. Evian and Samdasoo were used in this experiment. Because their hardness differs, the amount of EDTA required should also differ.
Dependent variable: The dependent variable is the amount of EDTA needed to reach the endpoint. It changes according to water hardness and thus according to sample type. It is determined by comparing the EDTA remaining in the burette after the reaction with the initial volume of 50 mL.
Controlled variables: The controlled variables are shown in the table below.
Experimental Materials and Equipment
Experimental Procedure
1. Mix 5 mL of 0.01 M EDTA solution with tap water at a ratio of 1:9, making 50 mL in total, and transfer the solution to a burette.
2. Pour 50 mL of the sample—Evian (Sample 1) or Samdasoo (Sample 2)—into an Erlenmeyer flask, and add five drops of EBT solution.
3. Add 1 mL of standard buffer solution to maintain a constant pH and ensure that the reaction proceeds accurately.
4. Place the Erlenmeyer flask beneath the burette and titrate with EDTA until the solution in the flask turns blue.
5. Calculate the total volume of EDTA added from the volume remaining at the moment the solution turns blue.
In this experiment, Steps 1–5 were performed once.
6. Because the sample volume and EDTA concentration and volume are known, calculate the metal-ion concentration in the sample using M × V = M′ × V′.
Data Collection
<Amount of EDTA Required for Titration by Sample>
Both samples changed to blue almost instantaneously upon reaching the endpoint.
Data Processing and Analysis
The equation M × V = M′ × V′ was used to calculate the metal-ion concentrations. For both samples, V′ = 50 mL and M = 0.001 mol/L.
For Sample 1, the reaction ended after 50 mL of EDTA had been added, so V = 50 mL. According to the formula, the metal-ion concentration was 0.001 M, or 10^(-3) M.
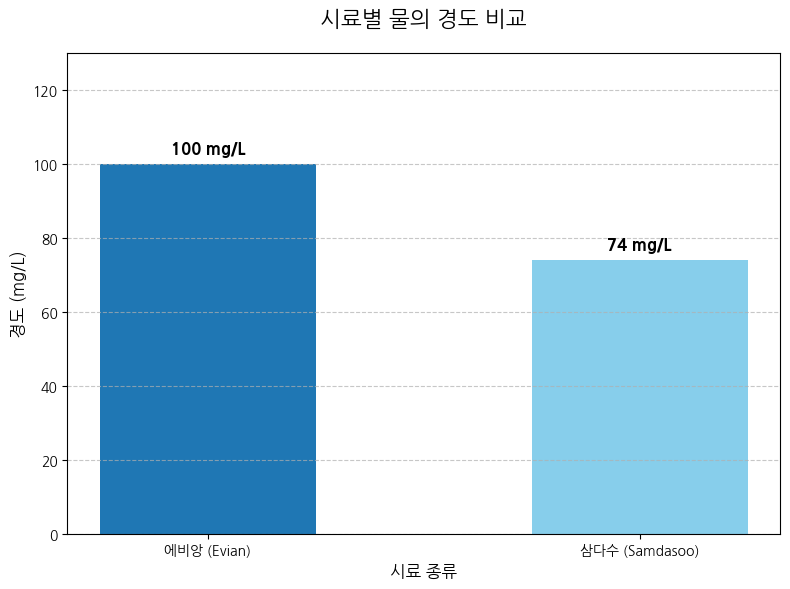
For Sample 2, 37 mL of EDTA was added, so V = 37 mL. Its metal-ion concentration was therefore 0.00074 M, or 0.001 M × 0.74. These results can be represented in the following table and graph.
<Metal-Ion Concentration of Each Sample>
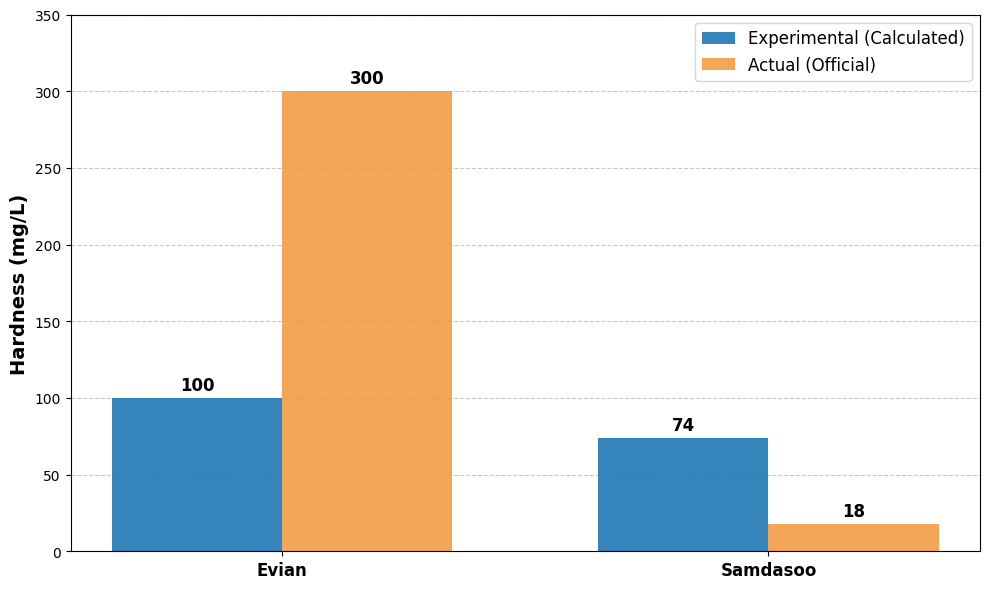
However, one serious problem was that the measured hardness of Samdasoo was much too high. Its actual hardness is 18.7 mg/L, substantially different from the measured value of 74 mg/L. This appears to have occurred because tap water was used to dilute the EDTA. The EDTA had already bound to metal ions present in the tap water, resulting in a measurement higher than the actual hardness. This can be seen in the graph below.
<Comparison of Water Hardness by Sample (Measured vs. Actual)>
Conclusion
The research question was: “How does water hardness affect the amount of EDTA required for titration?”
The independent variable in this experiment was the concentration of metal ions in the samples. Changes in that concentration produced differences in the amount of EDTA required. Sample 1 had a higher metal-ion concentration than Sample 2 and required more EDTA. Thus, the initial hypothesis—“The greater the water hardness, the larger the amount of EDTA required to reach the endpoint”—was supported. The independent variable (water hardness) and dependent variable (amount of EDTA) therefore have a directly proportional relationship.
Furthermore, because Evian’s metal-ion concentration was 100 mg/L, it can be classified as moderately hard water. Samdasoo, with a measured concentration of 74 mg/L, can likewise be classified as moderately hard water.
Evaluation
Systematic errors: The greatest limitation of this experiment was the possibility of measurement error. Although equipment such as a burette was used to regulate EDTA volume carefully, a dropper was used instead of a pipette, and the initial volume of EDTA in the burette may have varied slightly. These problems could be addressed by using a more accurate pipette to control sample and EDTA volumes precisely. The dilution from 0.01 M to 0.001 M EDTA may also have been performed at an inaccurate ratio. The unusually high hardness measured for Samdasoo because of the use of tap water could be avoided by using distilled water instead.
Random errors: Possible random errors include differences in the total time taken to conduct the experiment and failure to turn the burette stopcock at exactly the right moment. Repeating the experiment several times would help address these errors.
References
haudaa. (2018). https://blog.naver.com/haudaaa/70038659534
Serotonin. (2014, August 4). EDTA titration of Ca and Mg in tap water. Chemistry. https://joonyoungsun.tistory.com/entry/%EC%88%98%EB%8F%97%EB%AC%BC-%EC%A4%91-Ca%EC%99%80-Mg%EC%9D%98-EDTA-%EC%A0%81%EC%A0%95
Determination of Ca2+ and Mg2+ concentrations in tap water or groundwater using EDTA titration. (2024, October 28). Happycampus. https://www.happycampus.com/aiWrite/topicWiki/135231
ReportWorld. (2008, December 16). Results report on measuring water hardness using EDTA titration. https://m.reportworld.co.kr/eng/e564623
Thinkzon. (n.d.). Experimental report on determining water hardness by EDTA titration. https://www.thinkzon.com/share_report/687907
RESEARCH MATERIALS
Figures & Photographs
Visual materials accompanying the original research.